

Fink Tank
Current Hotline
What Sept. 21 Revealed About Gamma
The options market does not predict the weekend’s headlines, but it does help determine how forcefully the market absorbs them.
The weekend of Sept. 19-20 handed investors every excuse to stay in bed. The Fed had just raised rates for the first time in three years, Iran and the United States were trading threats and U.S. crude had closed Friday near $100 a barrel. On Monday, Sept. 21, the S&P 500 jumped 1.49% to 7,764.70, and the Nasdaq Composite rose 2.26% to its first record close since June.
I read the weekend news and would have bet on red. That is precisely why I try not to trade the weekend news.
The weekend headlines set the expectation. Monday morning’s headlines explained the direction. Oil fell 4.5%, Treasury yields eased and traders bought the hope of U.S.-Iran diplomacy and a Trump-Xi summit. The S&P climbed all session without a meaningful pullback, then gave back nearly the whole gain over the next seven sessions, closing at 7,651.54 on Sept. 30.
Delta Once, Gamma All Day
Every option trade has two sides. When you buy a call, the seller is usually a market maker or dealer: a firm that wants no part of your bet. Market makers have no opinion on AI. They have a spreadsheet and a very short attention span. So, the first thing a dealer does after selling you a call is hedge it, usually by buying some of the stock.
How much stock depends on the option’s delta, the number of shares the option currently behaves like. A call with a 0.40 delta gains about 40 cents for every $1 the stock rises, so one contract, which covers 100 shares, acts like 40 shares. The dealer who sold it buys 40 shares and stops caring which way the stock goes. For a moment.
Gamma is the catch. Delta doesn’t sit still. As the stock rises, the call behaves like more and more shares, and as the stock falls, fewer. Gamma measures how fast delta changes. If delta is the speedometer, gamma is how hard someone is pressing the gas.
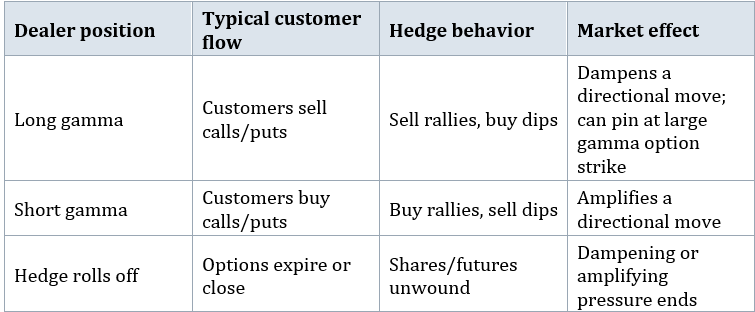
Say the stock rises $10 and the call’s delta climbs from 0.40 to 0.55. The dealer is now covering a 55-share position with 40 shares and has to buy 15 more into a rising market. If the stock falls back, the dealer sells. A dealer who has sold options is short gamma: forced to buy when prices rise and sell when they fall, which pushes the move further.
Flip it around. When customers are the sellers, collecting income by writing covered calls or selling puts, the dealer owns the options and is long gamma. Now the hedging runs the other way. The dealer sells into rallies and buys dips, which calms the market down.
Add up every dealer position in an index and you get one net number. Positive means dealers are dampening moves; negative means they’re amplifying them. The price where it switches from one to the other is the gamma flip, and it’s the level the gamma exposure websites try to pin down.
The market-impact cheat sheet
What the Gamma Map Showed
The test is where the gamma flip sat on Sept. 21. FirmTape, which reconstructs dealer positioning from the same-day options tape, put the closing flip at 7,765.4. SPX closed 0.6 points below it, on the negative-gamma side, where dealer hedging adds fuel instead of applying the brakes.
The opening flip level could have been different from the closing flip level, but assuming the levels matched, the trading day’s bullish price action fit the gamma profile. After gapping higher at the open, the index added another 70 points and spent 99% of the day above its volume-weighted average price. FirmTape flagged the day’s three sharpest one-minute jumps, and each lined up with a big shift in the dealer book and no news headline.
The Gamma Maps Are Guessing
FirmTape builds its map from the trade tape, and its live feed is paid. Most free gamma maps start from open interest, the count of option contracts outstanding at each price. Open interest tells you how many contracts exist but not who owns them, so the websites guess. The usual guess is that customers sell calls and buy puts. It fails in a call-buying frenzy.
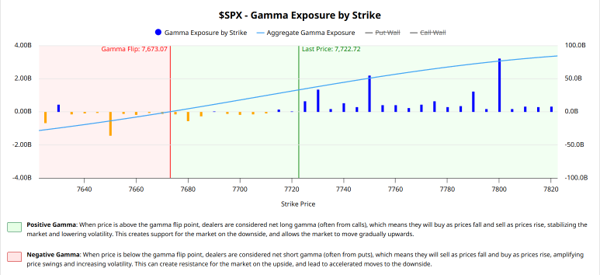
Barchart’s free SPX gamma map at the Oct. 2 close. Built from open interest, it puts the flip at 7,673 and the call wall at 7,800, just above the record close.
Guess the owner wrong and the map flips, showing calm where there’s a feedback loop while every number still looks precise. On Sept. 18, a single buyer spent $96 million on two-week chip calls, leaving dealers short calls, the opposite of the usual guess. More on that call option bet in my next article.
Gamma Has an Expiration Date
Dealer hedges exist only as long as the options behind them exist. When a big expiration rolls off, a whole layer of positioning disappears overnight. Sept. 18 was not merely a regular monthly options expiration, but a quarterly expiration as well, so Sept. 21 traded with much less ballast than the week before.
Two Lessons for the Rest of Us
Check the calendar before the chart. Expiration dates are when hedges vanish, and the sessions after a big one can move further than the news justifies.
Trigger on price, not on gamma exposure. Trading on gamma means trusting the map: expecting a selloff to find support at a big gamma level, or a rally to stall at one, and positioning in advance for it. Trading on price means using the same level as a tripwire. You don’t predict that it will hold. You wait, and act only if the index actually closes through it. The map tells you where to look. The price tells you what happened. That’s why the trade below exits on a price.
Neutral to Bearish Trade Idea: Call Credit Spread on S&P 500 Index (SPXW)
The spread below expires Friday, Oct. 9, before September CPI inflation data is released on Oct. 14 and before the big monthly options expiration on Oct. 16. As of last Friday, Barchart’s map showed SPX above its gamma flip level (i.e., positive gamma for dealers) with the biggest call wall at 7,800, so dealer hedging should lean against a breakout through the 7,798.99 record close. The threat is an ever-changing gamma exposure profile that could result in the flip level rising substantially above 7800, which would turn dealer gamma exposure negative and increase price volatility to the upside.
A bearish call credit spread — sell a lower-strike call, buy a higher one for cover — wants three things: an index you don’t expect to break out, a premium worth collecting and a cushion between the current price and the call option strike you sold.
Say SPX is trading near last Friday’s 7,722 close. You sell the 7,815 call, a 25-delta strike, and buy the 7,820 call, both expiring Friday, Oct. 9. These SPXW contracts settle on the Oct. 9 closing price at 4:00 PM Eastern Time. At last Friday’s closing prices, you collect about $1.20, 24% of the $5 spread width, and that’s the most you can make: $120 per spread. Max loss is the spread width minus the credit, $3.80, or $380 per spread.
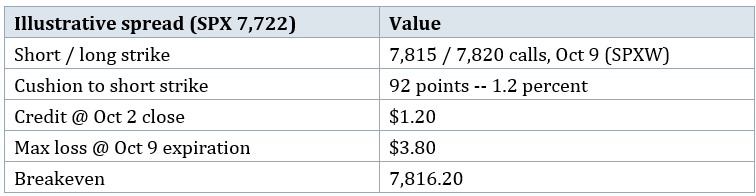
Credit based on Oct. 2 closing prices. With only a few days to expiration, the credit available will shrink quickly.
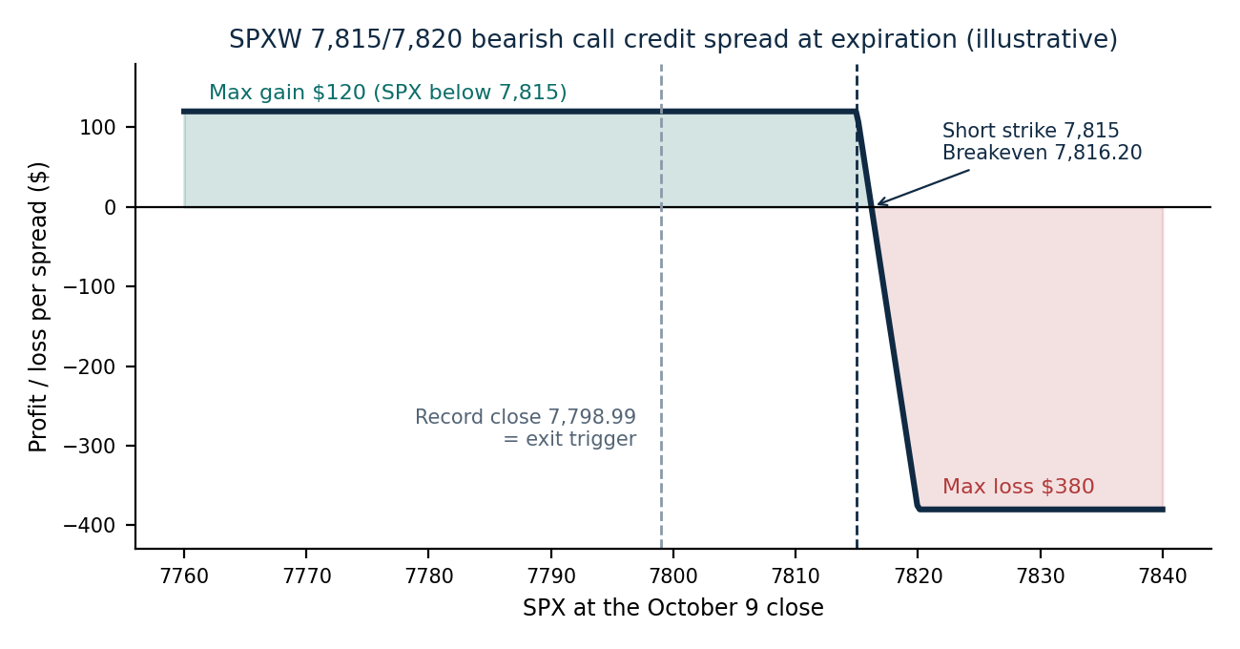
SPX doesn’t have to fall for this to pay. It only has to finish below 7,815 at the Oct. 9 close, 16 points above the record.
Stop-loss trigger. Close the spread if SPX closes above 7,798.99. A new record close means the ceiling has given way. Expiration: Friday, Oct. 9.
Beyond SPX: Where I’m Finding the Real Opportunities
A 1.20 per share credit on a five-point spread with a 1.2% upside cushion to the short call strike is a decent trade, but not a great one.
My Options for Income subscribers get weekly defined-risk trades on stocks whose seasonals don’t depend on ever-changing gamma exposure levels. Same structure, with specific strikes, expirations and an exit plan — without refereeing anyone’s gamma data.
If you’d rather trade the best opportunities the market offers instead of settling for a generic index, click here to join Options for Income today.
Search Jim Fink Investing
Log In
Forgot Password